1:  public static void DeCompressFile(string zipFilePath, string extractPath)
2:      {
3:        string zipToUnpack = zipFilePath;
4:        string unpackDirectory = extractPath;
5:        using (ZipFile zipfiles = ZipFile.Read(zipToUnpack))
6:        {
7:          // Here, we extract every entry, but we could extract conditionally based on entry name, size, date, checkbox status, etc.
8:          foreach (ZipEntry e in zipfiles)
9:          {
10:            e.Extract(unpackDirectory, ExtractExistingFileAction.OverwriteSilently);
11:          }
12:        }
13:
14:        Console.WriteLine("Status: Done extracting the zipped Archive");
15:      }
Thursday, May 26, 2016
Code snippet: Unzip the zip file in C# using DotNetZip
DotNetZip is a FAST, FREE class library and toolset for manipulating zip files. Use VB, C# or any .NET language to easily create, extract, or update zip files.


Code snippet: Read data from Access Database in C#
Read data from Access Database in C#
1:  private static void ReadFromAccess(string accessDbPath)
2:      {
3:        string connection = string.Format("Provider=Microsoft.ACE.OLEDB.12.0;Data Source= {0}",accessDbPath);
4:        using (OleDbConnection con = new OleDbConnection(connection))
5:        {
6:          try
7:          {  con.Open();
8:            OleDbCommand cmd = new OleDbCommand("SELECT * FROM Table_NAME", con);
9:            OleDbDataReader reader = cmd.ExecuteReader();
10:
11:            while (reader.Read())
12:            {
13:              Console.WriteLine(reader.GetString(0));
14:            }
15:
16:          }catch(Exception ex)
17:          {
18:            Console.WriteLine(ex.Message);
19:          }finally
20:          {
21:            con.Close();
22:          }
23:        }
24:      }
Thursday, March 3, 2016
Esri Leaflet Dynamic TileLayer Plugin Example
While working in one my Esri-Leaflet based application, I am stumbled on rendering dynamic map layers on tiled basis. Esri leaflet-api does the perfect job on non-tiled layer display but L.esri.DynamicMapLayer, doesn’t provide the tiled dynamic map layers. Looking around I came across the Tiled dynamic layer plugin for esri-leaflet, for displaying the DynamicMapLayer in tiled mode.
Here I have created both non-tiled and tiled DynamicMapLayer version for comparison using plain esri-leaflet and esri-leaflet with plugin.

Here I have created both non-tiled and tiled DynamicMapLayer version for comparison using plain esri-leaflet and esri-leaflet with plugin.
Gallery: Animated Dendrograms using D3.js
Lists of animated dendrograms using D3.js
1) Dendrogram with root to node selected path highlight, zoom and pan
2) Species sunburst
3) Species wheel with zoom pan feature
4) Collapsible dendrogram with root to node selected path highlight plus zoom/pan


How to display HTML5 applications from Github Gist to bl.ocks.org?
The http://bl.ocks.org is a simple viewer for HTML/CSS/JavaScript code examples hosted on Github Gist, which is built by Mike Bostock. In other words, blocks.org is a tool which will convert the Gist code into the format you see in bl.okcs.org allowing you to view HTML/ CSS / JavaScript applications directly from GitHub/Gist. GitHub is a web based version control and source code repository and Gists are a great way to share your source code among the peers.
Gists could be anything, but in HTML/JavaScript perspective, it could be a beautiful visualization using d3.js, interactive web map using Leaflet or Openlayers or ESRI Javascript API, and web map with WMS layers etc. Gists can share single files, parts of files, or full applications.
If you have built a beautiful visualization using HTML/JavaScript and want to view on blocks.org.
Here is how to do this.
Wednesday, January 6, 2016
Conference: MidAmerica GIS Symposium (MAGIC) 2016 Symposium

The 2016 Symposium will be held at the Overland Park, KS Convention Center April 24 - April 28, 2016 in Overland Park, Kansas. The conference hotel, the Overland Park Sheraton is adjacent to the Convention Center.
Why did we chose Overland Park? Overland Park is one of the fastest growing areas in the country. The OP Convention Center is very spacious - offering our Planning Committees ample opportunity to bring you new learning experiences! Additionally, we've listened to your concerns with previous location logistics:
- Parking: It's free and there is plenty of it!
- Internet: It's also free EVERYWHERE including the guest rooms, meeting rooms, and Exhibit Hall!
- The Gym: It's free too!
- Location: Downtown Kansas City can be intimidating. The Overland Park Convention Center is extremely easy to get to, and is right off a major highway. Additionally, the area is hopping with new entertainment and shopping districts, restaurants and museums!
GIS covers such a broad range of subjects, applications and types of people that use it, that developing a conference program that meets everyone's needs is a challenging task. Even more challenging is an attendee trying to figure out exactly which sessions or topics will be most interesting and helpful. MAGIC 2016 is intended to focus the content of the presentation options into a program specifically geared to each attendee's needs.
Nhibernate criteria API - select from multiple tables
If you ever worked with relational databases then higher chances are you already worked with sub queries. Some time while working with Nhibernate you get yourself into some situation where you need sub query to do some lifting for you. In NHibernate criteria API you can do the sub query usingDetachedCriteria and Subqueries classes. As the name suggests DetachedCriteria helps you define your sub query criteria while Subqueries class help you create sub query criterion object using detached criteria object.
In order to demonstrate sub query implementation lets consider an example. Suppose we have three entities Order, OrderItem and Product where one order can more have more then one order items while one order item may be linked to a product. If we need to do a query where we need to list all those order items which are linked to products and have price greater then $100. Also the products must be the ones marked as special in system. The SQL for such query may be something like below
In order to demonstrate sub query implementation lets consider an example. Suppose we have three entities Order, OrderItem and Product where one order can more have more then one order items while one order item may be linked to a product. If we need to do a query where we need to list all those order items which are linked to products and have price greater then $100. Also the products must be the ones marked as special in system. The SQL for such query may be something like below
SELECT * FROM OrderItem AS OI
WHERE OI.Price > 100 AND OI.ProductId IN ( SELECT P.ProductId FROM Product WHERE P.IsSpecial = 1 )
Tuesday, December 15, 2015
Conference: FOSS4G North America (FOSS4GNA) 2016, Raleigh, North Carolina
| ||
|

Wednesday, December 9, 2015
Leaflet WMS layer custom projection on fly
For most of the WMS mapping applications the Google Web Mercator (GWM) projection is sufficient. The GWM is default standard for web mapping and widley accepted by Bing, Google, OSM, OpenLayers(default), and Leaflets(default). However some mapping application required custom projection other than Google Mercator projection to display data. Then, how to project/re-project the data other than wms's default projection, GWM.
The following snippet shows the WMS layer custom projection in LEAFLET for Albers equal area and UTM zone 13.
Step 1.
First of all include -
leaflet.js
proj4.js
proj4leaflet.js in following order.
Step 2: Create new Proj4Leaflet CRS
Find your desired custom projection type in http://spatialreference.org/ and punch the the projection variable in the following code snippet.

The following snippet shows the WMS layer custom projection in LEAFLET for Albers equal area and UTM zone 13.
Step 1.
First of all include -
leaflet.js
proj4.js
proj4leaflet.js in following order.
     <link rel="stylesheet" href="http://cdn.leafletjs.com/leaflet-0.7/leaflet.css" />
     <script src="http://cdn.leafletjs.com/leaflet-0.7/leaflet-src.js"></script>
     <script src="//cdnjs.cloudflare.com/ajax/libs/proj4js/2.0.0/proj4.js"></script>
     <script src="http://mapserv.utah.gov/cdn/examples/proj4leaflet.js"></script>
Step 2: Create new Proj4Leaflet CRS
Find your desired custom projection type in http://spatialreference.org/ and punch the the projection variable in the following code snippet.

Friday, November 6, 2015
Passing R variables dynamically to JavaScript for data visualization
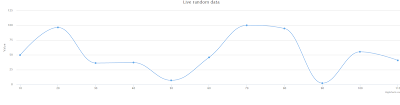
For a random project, I was interested to see if there a way to pass data between R and JavaScript. My purpose was to populate a Highcharts graph dynamically using preprocessed data from R. Of course, my first look was rCharts, an R package to create and publish interactive JavaScript visualizations, which also support the Highcharts for building interactive graphs and plots. The rCharts is a great package and widely popular among R users to create interactive charts without knowing the underlying JavaScript.
My requirement was not only the interactive chart but also dynamic that can create chart on near real time as shown in Highcharts demo. It seems to me that rCharts neither provide a straightforward way to add-point on series nor a way to customize the JavaScript to create such dynamic charts. As far as I know, it has limitations (or out of context of rCharts philosophy) for doing sophisticated jobs that requires JavaScript customization. At this moment it only supports the 24 functions from Highcharts API through R interface.
Subscribe to:
Posts
(
Atom
)
