Thursday, January 10, 2013

pyKML - a Python library for generating and parsing KML

Be The First To Comment


pyKML is an open source Python library for generating, parsing, and modifying KML, the geo-spatial data language used by Google Earth, Google Maps and a number of other GIS platforms.

pyKML helps working with large and complex KML documents by leveraging the use of basic programming constructs (looping, branching, etc.). In this regard pyKML is similar to libkml, Google’s open source C++ library, but takes advantage of the highly readable syntax of the Python programming language and the processing capabilities of the popular lxml Python library.


pyKML v0.1.0 documentation :  http://packages.python.org/pykml/


Wednesday, January 9, 2013

GIS Programming for GIS Analyst using Python

Be The First To Comment


Penn state has a nice collection of ArcGIS & Python programming step by step guide for their GEOG 485 students, which is also available for non-students via Penn state website.  This course’s is main aim is to make student able to use the Python scripting language to automate GIS tasks in ArcMap, assemble ArcView geoprocessing tools into models to solve GIS problems, and run the tools from scripts to automate GIS tasks. 

Although no previous programming experience is assumed, the course's target is to make a student as a GIS programmer/analyst in ArcGIS and Python environment. 

The course is basically divided into four parts:

Tuesday, January 8, 2013

Geographic Visualization for the Web : Book Review

Be The First To Comment


This book is an attempt to share the knowledge I've gained from the experts at Google. When I joined it, the KML team consisted of two engineers: Bent Hagemark and Michael Ashbridge ("Mash"). Bent and Mash's mission was to corral the existing KML into a formal XML schema, to create compelling examples that would represent good coding style, and to shepherd the language to its new and deserved status as an international standard. I was to create a website for KML and expand the existing documentation. I managed to complete that task, but it always felt as though I'd exposed only the tip of the iceberg. Well, here's The Iceberg.”          – Author

"KML Handbook :Geographic Visualization for the Web" is primarily targeted for people who are curious about how to create customized presentations for an Earth browser such as Google Earth but have little or no experience with computer programming. It has step by step guidelines to create and customize Google Placemarks and Ballons, Google Earth Overlay, Static and dynamic KML/KMZ update and manipulation.

Pro: This  book has  a step by step guide to writing and using KML programming language to produce enhanced graphics as overlays onto web based mapping programs such as Google Earth. You do not need to have any programming skills to use this book except basic knowledge of HTML and XML.

Con: Some images in the books are fuzzy and hard to read. It is highly Google centric, may be because the author, Josie Wernecke, senior technical writer at Google.


Spatial Developer must keep in your shelf : Book Review

Be The First To Comment


One of my client’s requirements was to create and open source geospatial DBMS to hold utilities and city shape files. As looking through the internet, I found PostGIS is an open source software program that adds support for geographic objects to the PostgreSQL object-relational database.  As project reference, I choose PostGIS in Action, as project accomplished successfully I realized  my judgment was excellent.

PostGIS in Action is a very comprehensive introduction to PostGIS for developers of all levels of experience. Basically it is split into 3 parts:

Part 1- Nice and slow startup with PostGIS. You can skip this section if you have prior knowledge about any kinds of spatial databases and geometry data types.

Part 2- Put PostGIS in work. It contains technical details on proximity analysis, geocoding addresses, manipulating polygons and lines, and scaling and rotating geometries as well as efficient queries and how to tune your database and
selection of appropriate indexes and keys for your data.

Part 3- Use of PostGIS with other tools and frameworks. It describes manage raster datasets in PostGIS with PostGIS raster module, development of Web applications using PostGIS.

The Book will provide the much needed skills in building a spatial database, Application Server, Desktop GIS and Cartographic map renderer, Map tile server and Web map component using the following software: PostGIS/PostgreSQL, GeoServer, Apache/Tomcat, uDIG, Openjump, QGIS, GRASS GIS and Openlayers.

Thursday, January 3, 2013

Learn Supercomputing - FREE FREE

Be The First To Comment


If you are considering migrating your work to the next
level of computational resources this is a great introduction to what's out there and how to get started. This year's "supercomputing in Plain English" workshop is free for audience of not just computer scientists but especially scientists and engineers, including a mixture of undergraduates, graduate students, faculty and staff.

These workshops focus on fundamental issues of HPC as they relate to Computational and Data-enabled Science & Engineering, including:


Friday, December 21, 2012

Dissolve ERROR 999999: Error executing function. The Geometry has no Z values.

Be The First To Comment

Solution to Dissolve ERROR 999999: Error executing function. The Geometry has no Z values.
ArcToolbox>Repair Geometry and delete features with empty geometries
ArcToolbox > Conversion Tools>To Shapefile>Environments>General Settings>Output has Z values = Disabled, Output has M values = Disabled>OK>Input features/Output features>OK
ArcToolbox>Dissolve> happy :))

Source

NASA Internship Opportunity for GIS Students

Be The First To Comment
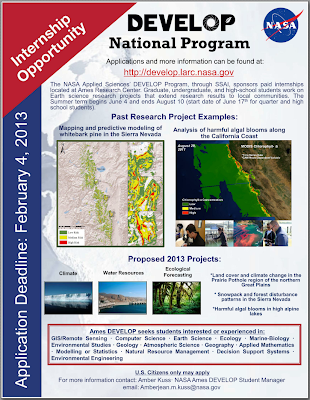
NASA announced NASA’s DEVELOP Summer 2013 Internship Program for undergraduate and graduate students with an interest in Geographic Information Systems (GIS) or Remote Sensing. This is a paid 10-week internship program located at NASA Ames Research Center in Mountain View, California that begins June 3, 2012 (for semester system) or June 17 (for quarter system).

Student teams research NASA science capabilities relevant to community concerns, create and complete projects using remote sensing and GIS techniques, and create advanced computer generated visualizations demonstrating research results. The activities are student-led, with mentors from NASA and partner organizations. Students of all majors are welcome to apply! Please see the attached flyer.

A stipend will be provided for selected students. Student housing options are also available on-site. Attached is a flyer to post in your department. Please feel free to forward this email to any other department or people you think might be interested. Applications must be postmarked by Monday February 4th, 2013. Interviews will be conducted after applications are received. Students selected for a summer 2013 DEVELOP internship will be notified by late April.

For further information on the DEVELOP Internship Program at NASA Ames Research Center, please access the National Program website at: http://develop.larc.nasa.gov

Wednesday, December 12, 2012

ASPRS 2013 Annual Conference

Be The First To Comment


The ASPRS 2013 Annual Conference is coming soon. Start making your plans to attend today!

Year 2013 promises to be an encouraging period due to the successful launch (fingers crossed!) of the LDCM Earth observing satellite (January 2013). We anticipate first look imagery from Landsat 8 will be presented at our conference!

Start making plans to attend today.

Don’t Miss these Conference Highlights:

v  Outstanding Keynote Session Speaker
v  Student & Young Professional Focused Events and Special Sessions
v  80+ Technical Paper Presentations
v  UAS Showcase in the Exhibit Hall
v  Outstanding Exhibitors
v  Social Project – Operation Sock Drop
*Workshops and the Classified Session are not included in the general registration fee. Special student pricing available for workshops. ASPRS reserves the right to cancel any workshop if the minimum number of registrations is not received. 
Click here to view the registration fees.

Landscape Dynamics Along Environmental Gradients 2013 Annual Symposium Austin, TX | April 14-18, 2013

Be The First To Comment

Call for Presentations USIALE 2013


The organizing committee of the 28th Annual Symposium of the U.S. Chapter of the International Association of Landscape Ecologists invites you to present your research in Austin, Texas this April 14-18, 2013. Our theme this year is “Landscape Dynamics Along Environmental Gradients.”
Presentation abstracts must be submitted by January 8, 2013. Notification of abstract acceptance will be given by February 1, 2013.

The meeting will attract educators and practitioners in the fields of ecology, biology, geography, geology, and landscape preservation and design dedicated to preserving and protecting our natural resources. Highlights will include workshops, plenary sessions, symposia, field trips, oral presentations and posters.

Austin and the Central Texas area are uniquely situated at the intersection of the Blackland Prairies, Cross Timbers and Edwards Plateau ecoregions. As such, the area is home to a large diversity of species and landscapes including iconic species such as the endangered golden-cheeked warbler and Barton Springs salamander. Mean daily low and high temperatures in April are 60F and 80F. Field trips will highlight unique environments of Central Texas including local research facilities, the Lady Bird Johnson Wildflower Center and excursions into the Hill Country.

To submit your abstract, please visit: http://www.usiale.org/austin2013/

Thursday, October 11, 2012

Extract Raster Values from Points

5 Comments
The R blog article encourages me to write this solution to extract Raster values from points in R.

In geospatial analysis, extracting the raster value of a point is a common task. If you have few raster files or few points; you can extract the raster value by overlaying a point on the top of the raster using ArcGIS. What will you do, if you have hundreds of raster files and thousands of points? The easy solution is use loop in Python and ArcGIS. Is loop efficient to use? No. Can loop be avoided? Yes.

Then how? 

Follow the steps:
Step 1: Create a Raster stack or Raster brick of your raster files using “raster” package in R.
For example:
rasStack = stack(raster1, raster2,raster3 …rasterN)

Step 2:  Read point data, and convert them into spatial points data frame.
Sample: pointfile.csv
Point_ID
LONGITUDE
LATITUDE
1
48.765863           
-94.745194
2
48.820552           
-122.485318
3
48.233939           
-107.857685
4
48.705964           
-99.817363
For example:
pointCoordinates=read.csv(“pointfile.csv”)
coordinates(pointCoordinates)= ~ LONGITUDE+ LATITUDE

Step 3: Extract raster value by points
For example:
rasValue=extract(rasStack, pointCoordinates)

Step 4:  Combine raster values with point and save as a CSV file.
For example:
combinePointValue=cbind(pointCoordinates,rasValue)
write.table(combinePointValue,file=“combinedPointValue.csv”, append=FALSE, sep= ",", row.names = FALSE, col.names=TRUE)

Step 5: You should get the results as following table.
Result: combinedPointValue.csv
Point_ID
LONGITUDE
LATITUDE
raster1
raster2
raster3
1
48.765863           
-94.745194
200
500
-100
2
48.820552           
-122.485318
178.94
18.90
10.94
3
48.233939           
-107.857685
-30.74
-30.74
-0. 4
4
48.705964           
-99.817363
0
110
-0.7


© 2011 GIS and Remote Sensing Tools, Tips and more .. ToS | Privacy Policy | Sitemap

About Me